
Overview
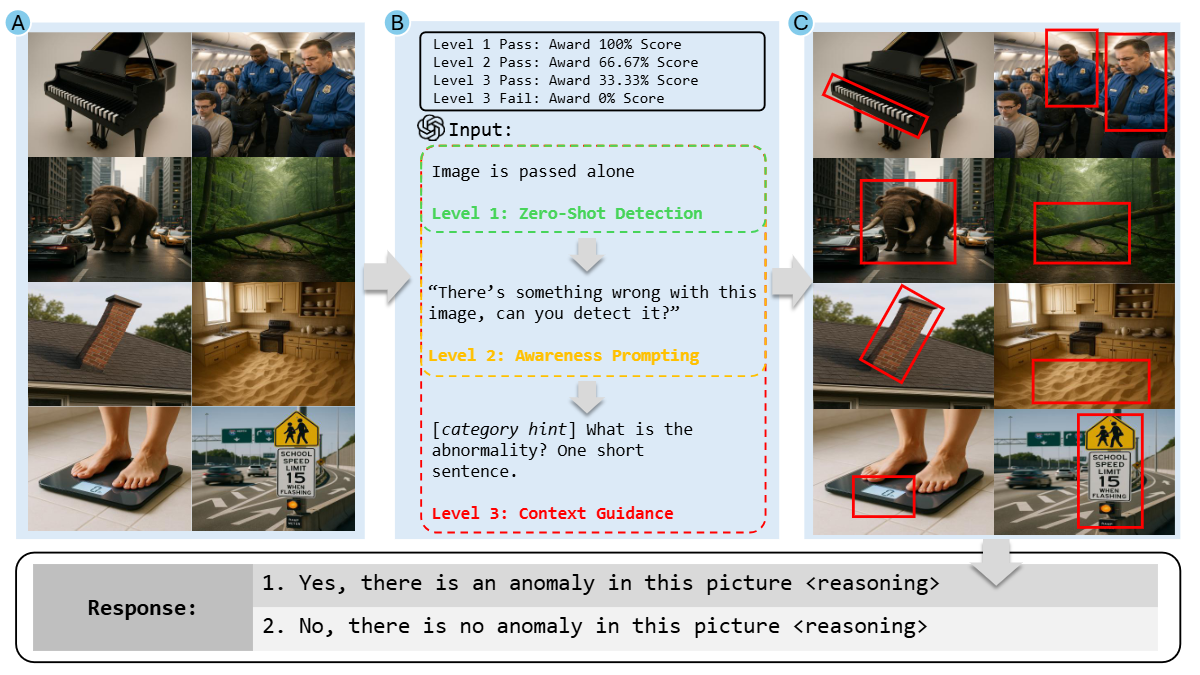
Large Vision Language Models (VLMs) excel at visual question answering and semantic grounding, but their capacity for autonomous logical reasoning remains underexplored. Existing anomaly benchmarks emphasize visual errors or direct prompting rather than the physical and social common sense needed for open-world deployment. To address this, we introduce LAD-bench, a benchmark of more than 1,000 curated synthetic images with logical anomalies across four domains: Residential, Urban, Collaborative, and Nature. We further propose a Tiered Prompting Protocol based on progressive disclosure, which measures how much explicit assistance a model needs to localize and reason about a logical fault. Evaluating leading foundation models reveals substantial weaknesses: even the best achieves only 70.11% overall accuracy, showing that implicit logical fault detection remains unsolved. Crucially, models often fail to identify anomalies even after receiving explicit hints in deeper tiers. By surfacing these limitations in sequential multimodal reasoning, LAD-Bench offers a rigorous framework for advancing the safety, reliability, and cognitive alignment of autonomous visual systems.
Dataset
The dataset for LAD-Bench is fully synthetic and contains over 1,000 images generated using OpenAI’s gpt-image-1 model, selected for its image generation quality, speed, and prompt fidelity. Using synthetic images also reduces the risk of overlap with existing training data, since the samples are newly created. This also makes adding to the dataset simpler. The images are organized into both a super category and a sub category. The super categories are Nature, Collaborative, Urban, and Residential, and are designed to consider settings of human inhabitation or frequent human interaction. The sub categories are more specific, and help in organizing images into specific settings or processes associated with humans in the super categories. A small dataset of 100 negatives, where no anomaly is present, is also provided.
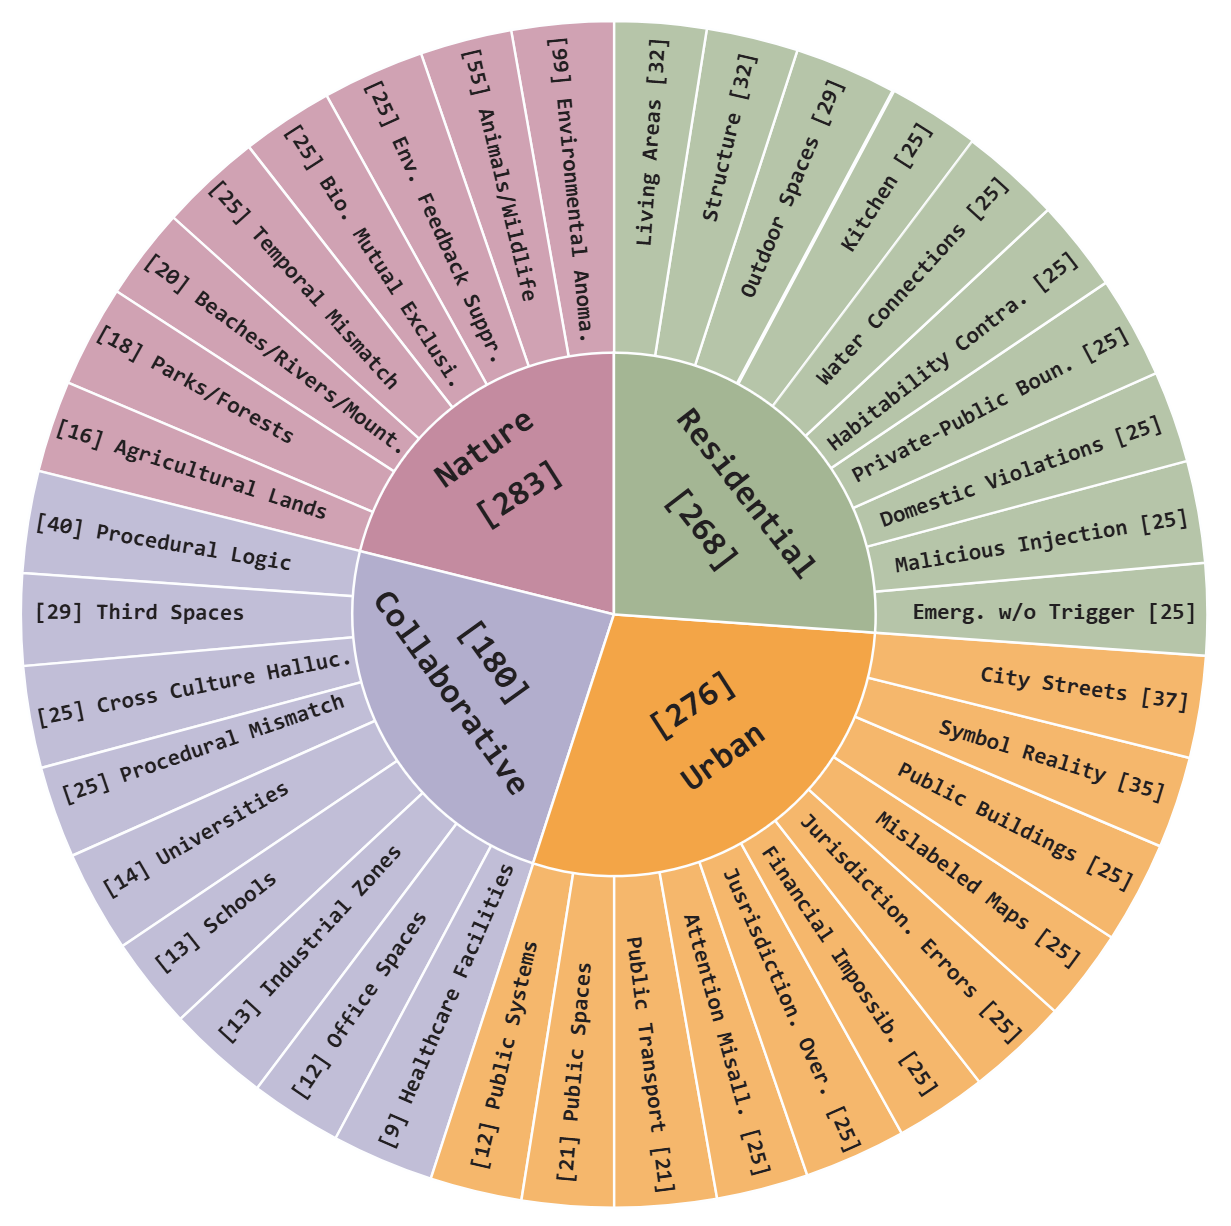
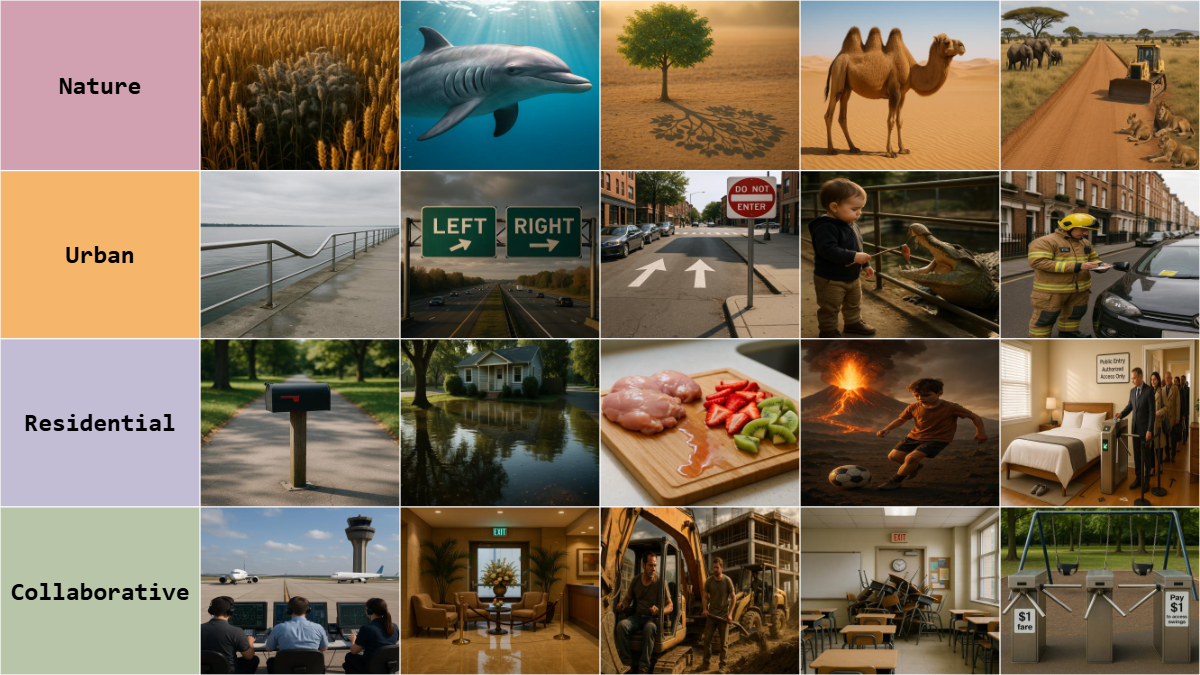
The images are spread accross a number of real world categories. Anomalies can range from subtle to obvious. Examples are shown below.
Approach
The benchmark uses a Tiered Prompting Protocol, where there are three levels of progressive disclosure and assistance. Level 1 provides no assistance or companion prompt with the image, and holds the highest weightage in results. Level 2 provides explicit disclosure about the existence of an anomaly, and rewards 66.67% towards their overall accuracy. Level 3 provides a hint, which uses the sub category to direct the model’s attention, and awards 33.33% towards their overall accuracy. If the model fails after all this, it gets 0% for that image.
To automate grading, we use OpenAI’s gpt-5-nano as our grading module. It is given ground truth label, the response to be graded, and some other instructions to explain the task at hand. The grading and prompting protocol is slightly different between the pictures with anomalies and without. For those with anomalies, an image is only tested at a level if it failed the previous level. If it succeeds at one level, it will not be passed for the remaining levels. For those without, an image is tested at all three levels. There is a high rate of success at level 1, since there’s neither direction nor anomaly. For level 2, we tell the model that there is an anomaly in this image, which also misdirects them. At level 3, we ask the models to look carefully and tell for certain if there is any anomaly in this image. We graded all responses for this dataset manually, and did not include it in our paper’s published results.
Results
Accuracy comparison across models on the evaluation dataset. Results are reported by category (Residential, Urban, Collaborative, Nature) and reasoning levels (Level 1-3), along with overall weighted and tuned accuracies. Models are compared based on weighted accuracy. Performance generally improves at Level 2 with added hints but declines at Level 3. Toned accuracy reflects adjustments from human-verified false positives and false negatives.
Table: Accuracy comparison across models on the evaluation dataset
| Model | Category | Level One | Level Two | Level Three | Weighted Accuracy | Toned Accuracy |
|---|---|---|---|---|---|---|
| gpt-5-mini | Residential | 41.79% | 64.10% | 42.86% | 65.96% | 60.85% |
| Urban | 31.52% | 62.43% | 42.25% | |||
| Collaborative | 23.33% | 62.96% | 28.00% | |||
| Nature | 39.58% | 70.76% | 36.00% | |||
| Total | 35.05% | 64.83% | 37.39% | |||
| No Anomaly | 99.00% | 15.00% | 49.00% | |||
| gpt-5 | Residential | 51.12% | 48.09% | 48.53% | 67.20% | 70.94% |
| Urban | 40.94% | 46.01% | 47.73% | |||
| Collaborative | 33.89% | 46.22% | 23.44% | |||
| Nature | 49.47% | 65.03% | 30.00% | |||
| Total | 44.79% | 51.44% | 38.89% | |||
| No Anomaly | 100.00% | 10.00% | 99.00% | |||
| claude-sonnet-4-6 | Residential | 45.52% | 52.74% | 44.93% | 70.11% | 72.98% |
| Urban | 49.28% | 60.71% | 45.45% | |||
| Collaborative | 35.56% | 62.07% | 29.55% | |||
| Nature | 48.41% | 64.38% | 30.77% | |||
| Total | 45.58% | 59.85% | 38.64% | |||
| No Anomaly | 98.98% | 29.59% | 64.29% | |||
| gemini-3-flash-preview | Residential | 52.61% | 32.28% | 30.23% | 67.33% | 76.63% |
| Urban | 56.88% | 27.73% | 36.05% | |||
| Collaborative | 48.89% | 34.78% | 16.67% | |||
| Nature | 56.54% | 37.40% | 32.47% | |||
| Total | 54.22% | 32.97% | 29.77% | |||
| No Anomaly | 97.00% | 20.00% | 44.00% | |||
| grok-4.1-fast-reasoning | Residential | 32.09% | 51.10% | 28.09% | 55.28% | 65.91% |
| Urban | 34.06% | 44.51% | 34.65% | |||
| Collaborative | 24.44% | 38.24% | 19.05% | |||
| Nature | 22.61% | 57.53% | 27.96% | |||
| Total | 28.60% | 48.96% | 27.79% | |||
| No Anomaly | 100.00% | 46.00% | 84.00% | |||
| llama3.2-vision:11B | Residential | 3.36% | 18.53% | 17.54% | 18.67% | 22.37% |
| Urban | 5.43% | 16.86% | 13.82% | |||
| Collaborative | 1.67% | 14.12% | 9.21% | |||
| Nature | 6.36% | 16.98% | 10.91% | |||
| Total | 4.47% | 16.84% | 13.13% | |||
| No Anomaly | 93.00% | 34.00% | 64.00% | |||
| qwen3-vl:8B | Residential | 23.88% | 20.59% | 31.48% | 43.66% | 48.48% |
| Urban | 28.99% | 21.43% | 33.77% | |||
| Collaborative | 21.67% | 23.40% | 16.67% | |||
| Nature | 31.45% | 28.87% | 26.09% | |||
| Total | 27.01% | 23.54% | 27.93% | |||
| No Anomaly | 100.00% | 2.22% | 49.15% |
Acknowledgments
This work is supported by NSF Award DGE #2235102 (CyberCorps Scholarship for Service: Cybersecurity Research and Education for Service in Government - CREST), the NVIDIA Academic Grant Program.
BibTeX
@misc{kondapalli2026ladbenchbenchmarklogicalfault,
    title={LADBench: A Benchmark for Logical Fault Detection in Images},
    author={Sahasra Kondapalli and Lara Radovanovic and Aadi Palnitkar and Mingyang Mao and Xiaomin Lin},
    year={2026},
    eprint={2606.17433},
    archivePrefix={arXiv},
    primaryClass={cs.CV},
    url={https://arxiv.org/abs/2606.17433},
}